Why look at the data
Sometimes in Italy, a station has no screen at all, no information about the trains coming. Only the speaker. That is where my train tracking project comes from, and its goal is to turn macro data into micro data: the official source only says “this train was seen at this station, N minutes late”, and between two stations there is nothing. I want to estimate where a train is along the track, even far from any station.
A model needs data, so step one was the collector: a small server that asks ViaggiaTreno, the Italian railways information service [1], about the trains of the area around Genoa and writes everything in a SQLite database. It has been running since 12 October. I recorded everything without knowing exactly which questions I would ask later, and this post is the first time I ask them.
This is step two: study the data before modelling it. Not to prove anything, but to know what I am working with and what the model will have to beat. What runs, and when? What does the area look like? How late are the trains, at which hour, in which station, on which section? Does a train that leaves late stay late? Every number comes with the quantity behind it, and every symbol of every equation is defined where it appears.
Eight numbers to impress at dinner
If you keep only one section, keep this one. Each number is explained further down.
The data
Two tables
The collector writes two tables that matter here. A row of trains is one train on one service day. A row of stops is one station on the route of one train.
-- trains: one row = one train on one service day
number         -- the train number, e.g. 3277
category       -- REG, IC, ICN, FR, FA, FB, EC...
departure_ms   -- midnight of the service day, not an hour
origin, destination
first_seen     -- when the collector found the train
last_poll      -- the last time it asked about it
n_polls        -- how many times it asked
status         -- done | lost | cancelled | active
-- stops: one row = one station on the route of one train
train_id, seq, station, station_name
sched_arr      -- scheduled arrival
real_arr       -- real arrival (empty if never reported)
delay_arr      -- announced delay, in minutes
sched_dep, real_dep, delay_dep    -- the same for the departure
Here is the REG 3277 of 19 November, from Genova Brignole to La Spezia Centrale, as the database holds it. First its row in trains:
number=3277  category=REG  status=done  n_polls=23
origin=GENOVA BRIGNOLE  destination=LA SPEZIA CENTRALE
departure_ms=19 Nov 2026 00:00  first_seen=15:07  last_poll=18:28
Then some of its rows in stops, the arrival side first:
seq | station_name | sched_arr | real_arr | delay_arr |
|---|---|---|---|---|
| 0 | GENOVA BRIGNOLE | NULL | NULL | 0 |
| 1 | GENOVA NERVI | 16:57 | 17:00 | 4 |
| 4 | RAPALLO | 17:18 | NULL | 0 |
| 6 | SESTRI LEVANTE | 17:34 | 17:46 | 12 |
| 10 | LA SPEZIA CENTRALE | 18:10 | 18:21 | 12 |
and the departure side of the same rows:
seq | sched_dep | real_dep | delay_dep |
|---|---|---|---|
| 0 | 16:45 | 16:48 | 3 |
| 1 | 16:58 | 17:02 | 5 |
| 4 | 17:19 | 17:29 | 11 |
| 6 | 17:35 | 17:48 | 14 |
| 10 | NULL | NULL | 0 |
The delay grows along the way, from 3 minutes at the origin to 12 at the terminus. The first row has no arrival (a train does not arrive at its origin) and the last has no departure.
In total the database holds 22,641 trains (961 distinct numbers), 326,584 stops and about 420,000 polls. Three details of these two tables shape everything that follows:
departure_msis not an hour. It is midnight of the service day. The hour of the day for the volumes is rebuilt from thestopsof the train: from its first to its last stop in the network. (first_seentolast_pollis not used: the collector finds a train long before it leaves and keeps asking after it arrives, so that window made the day look about three times busier than it is.) For the delays, the hour is the one ofsched_arr, which is exact.delay_arr = 0is not always a measurement. When the feed never says that the train arrived (real_arris empty, like Rapallo above), the delay is stored as 0. That is the case of 72,430 stops out of 326,584. Every delay in this study is computed on the 231,504 stops with areal_arr.- The collector did not always watch the same area. More on that in the next section.
The frame: a network of 105 stations
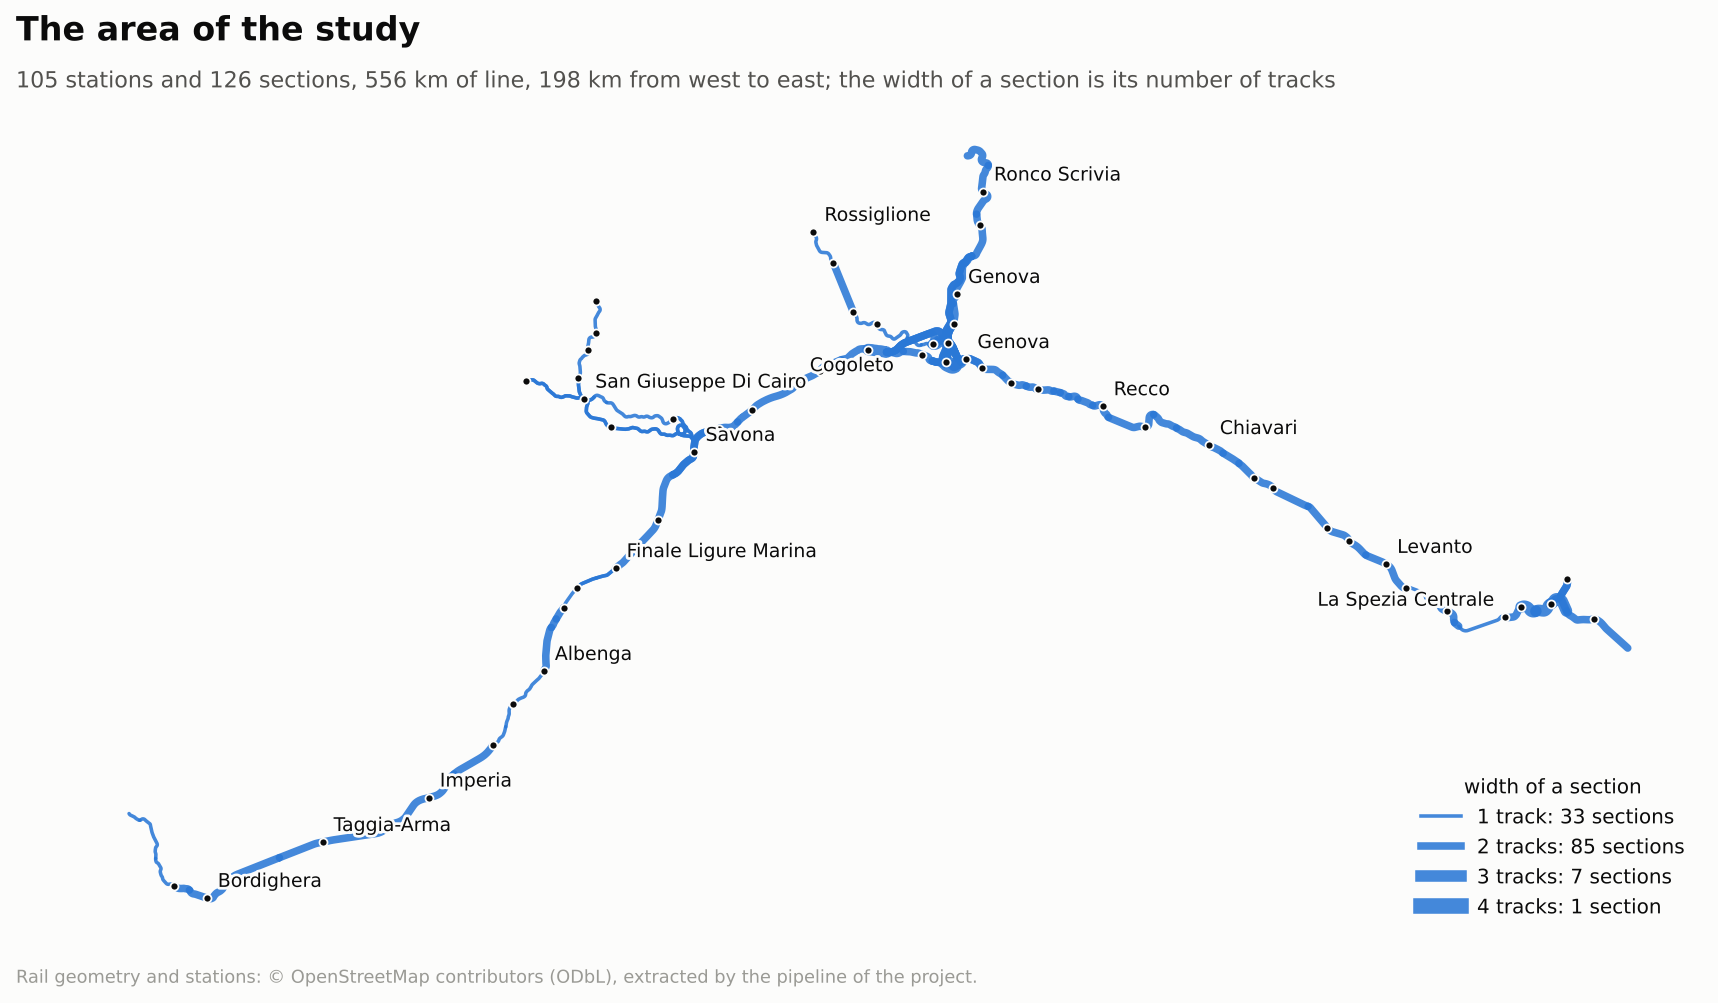
The area of the study is the network of the project: 105 stations, each with its GPS position, and 126 sections, the segments of line between two neighbouring stations. Together they make 556 km of line, 198 km from west to east and 98 km from north to south. The geometry comes from OpenStreetMap, extracted by the pipeline of the project; there are no map tiles in this post, the lines drawn are the data. Fig. 1 shows it.
The same graph, with the colour of each section telling how busy it is (Fig. 2), shows where the trains actually run:
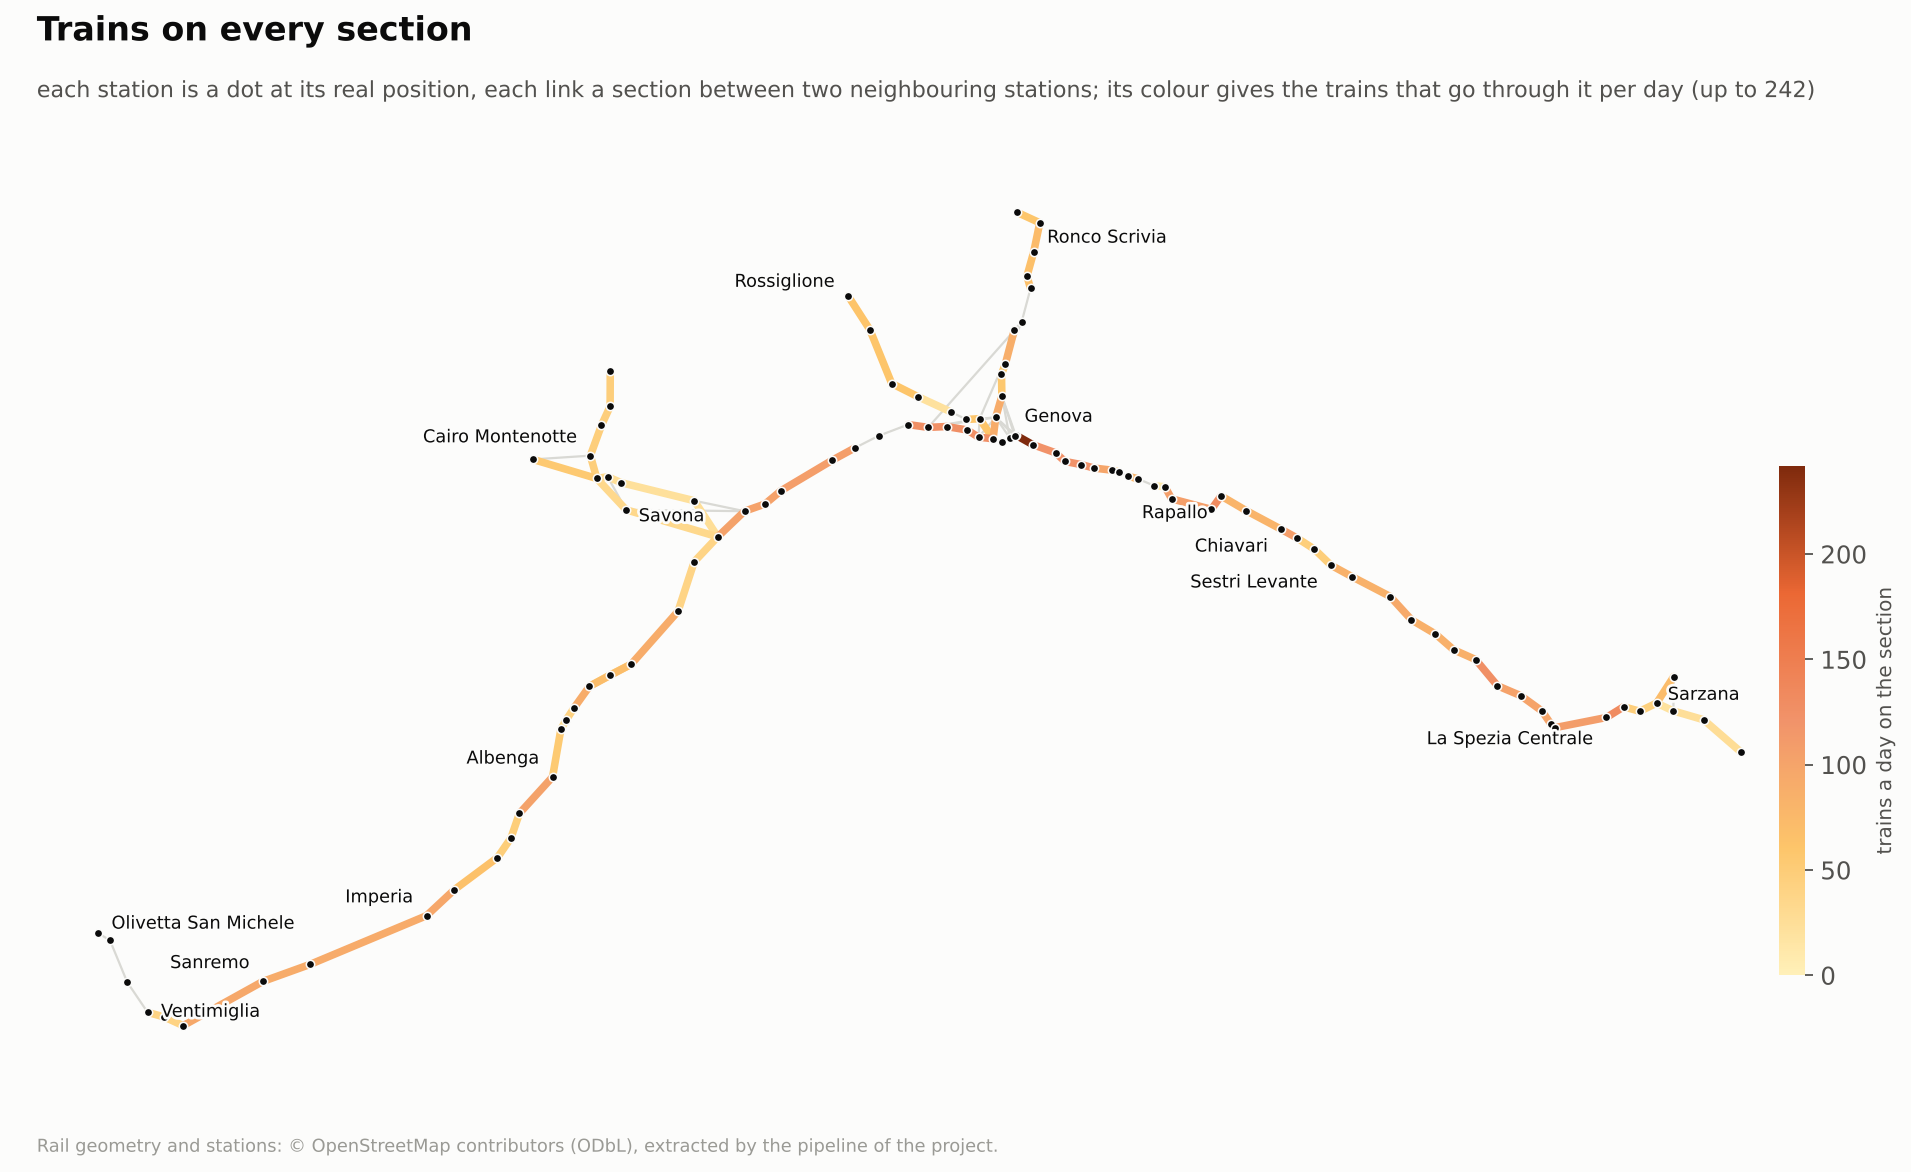
One section stands out: Principe to Brignole, with 242 trains a day, where the lines of the Genova junction meet. Every other section stays under 90: 60 to 90 around Genova and on the Levante up to La Spezia, about 50 on the Ponente, and 10 to 30 on the lines going inland (Savona to Cairo, Genova to Ronco Scrivia, Rossiglione).
Of the 126 sections, 85 have two tracks (353 km), 33 have one (184 km), 7 have three and 1 has four. A section is the unit used later to locate where a delay builds up or is recovered.
The frame also settles a question about what a delay means. Long-distance trains report their stops far outside Liguria, in Tuscany or in Puglia, where a delay says little about the Ligurian network. So every delay figure keeps only the stops of the 105 stations: 103,384 of the 201,310 stops with a real arrival in the 30 full days, 51 %.
Which days
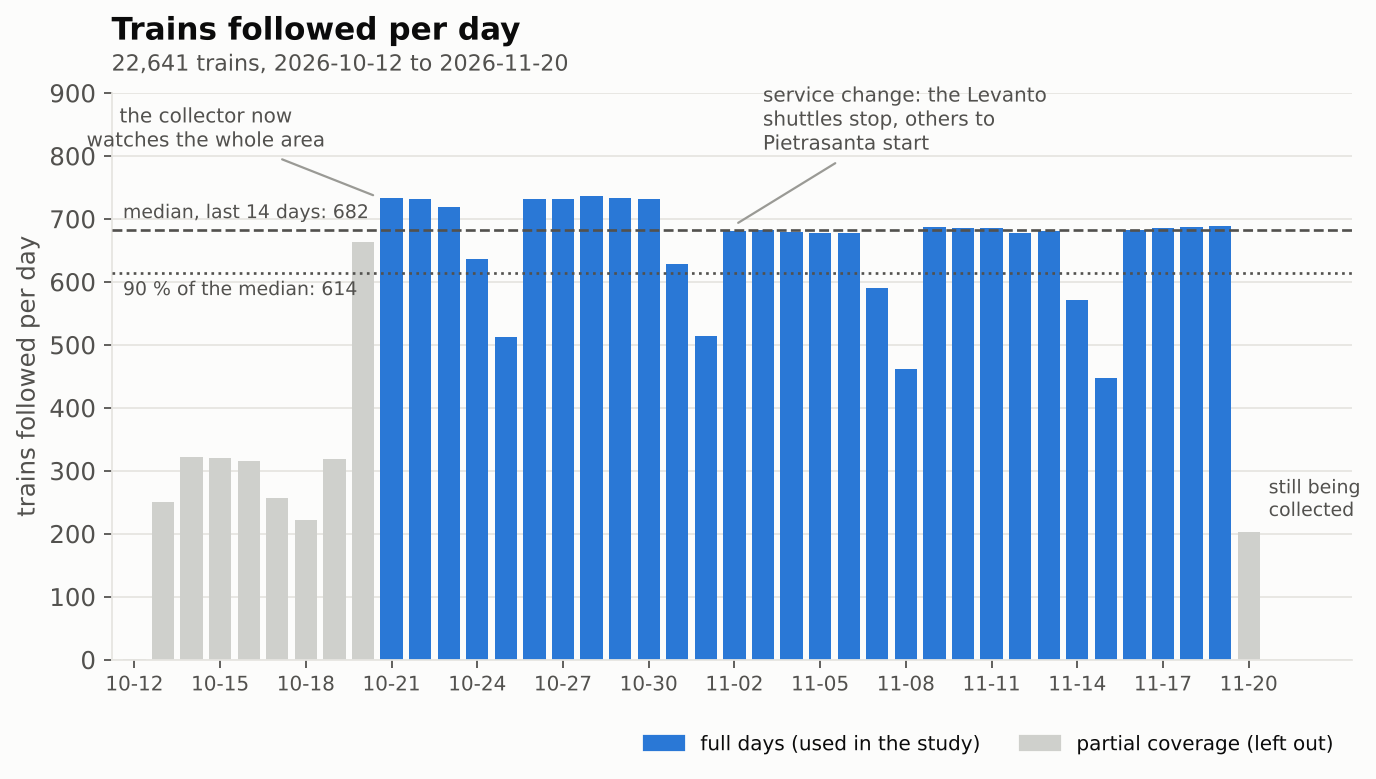
As Fig. 3 shows, until 19 October the collector saw less than half of the trains, and any average mixing those days with the others would be wrong. The rule is simple: the recent level is the median of the last 14 full days (the day still being collected is not counted). The first day to reach nine tenths of it is a transition and is skipped, and the study starts the day after. Weekends fall below that line without leaving the study: it only dates the day the collector began to watch the whole area.
$$ n_d \ge 0.9\,\tilde n \quad \text{Eq (1)} $$
- $n_d$ is the number of trains followed on day $d$;
- $\tilde n$ is the median of $n_d$ over the last 14 days, the level the collector has now.
That leaves 30 full days, from 21 October to 19 November: 22 weekdays, 4 Saturdays and 4 Sundays. The weekly and daily profiles use the last two weeks only, so that no change of service falls inside them.
How much the stations tell
Everything that follows rests on the feed saying when a train reached a station. It does not do so everywhere, and that limits what the delay figures can say. For each of the 163,315 stops of a train at one of the 105 stations (over the 30 full days), the feed can give a real time of arrival (real_arr) and a real time of departure (real_dep).
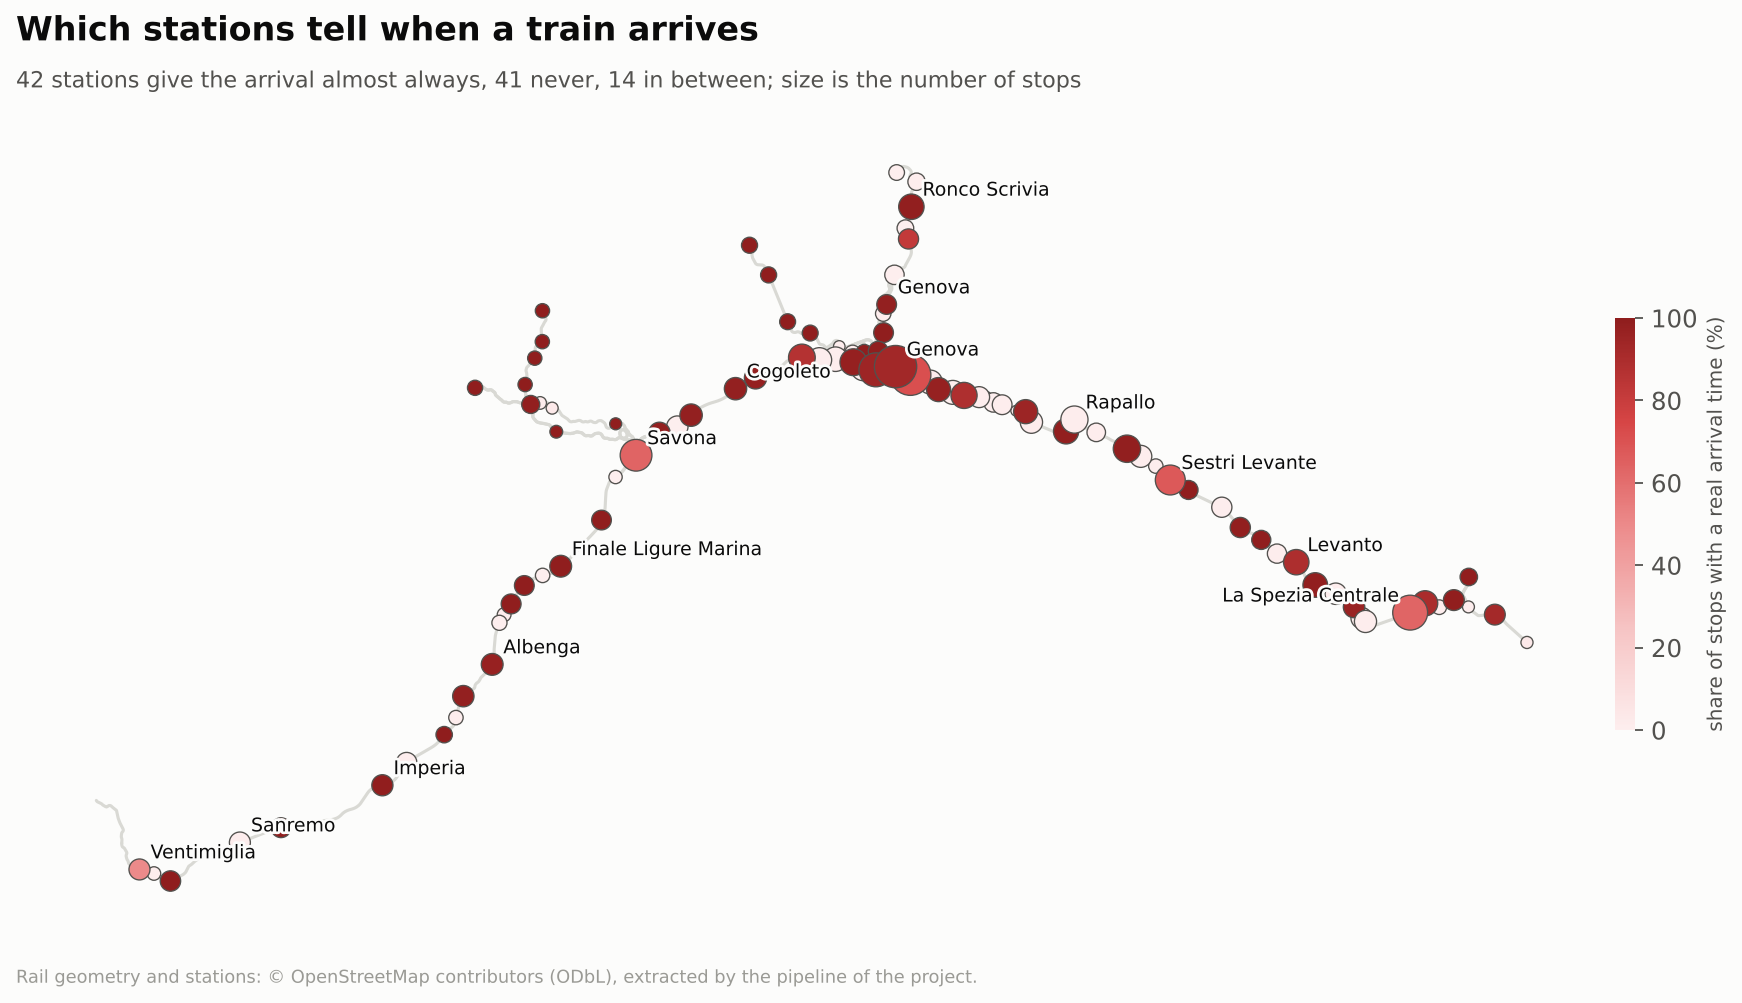
Fig. 4 maps the share of stops with a real arrival time, station by station. The departure tells another story (Fig. 5):
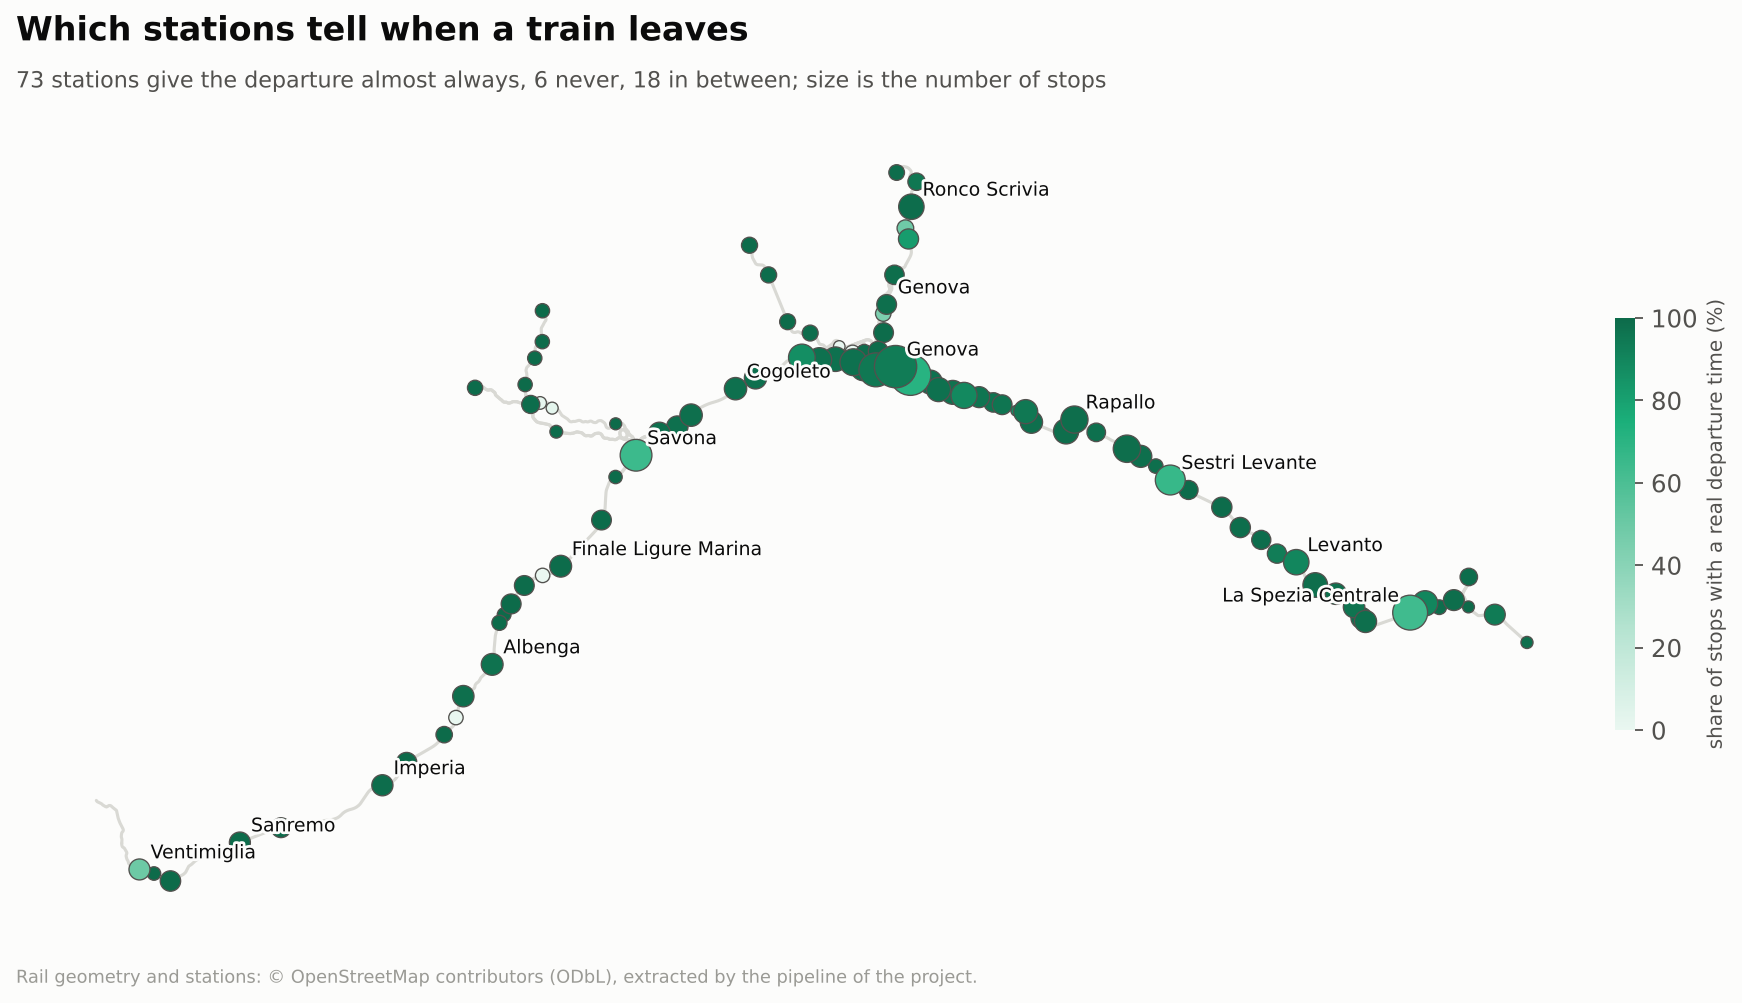
Put together, the stops fall into four groups:
- 57 % have both a real arrival and a real departure time;
- 33 % have only the departure;
- 6 % have only the arrival;
- 3 % have neither.
A study by departure would see 90 % of the stops instead of 63 %. I used the arrival because it is the time that says how late a train is for the people waiting, and kept the departure where it is needed: the first stop of a journey and the sections between two stations.
What it changes for the rest of the study:
- The delay figures use arrivals. They cover the 63 % of stops that have one, 103,384 stops, and the 41 silent stations are almost all absent from the rankings by station.
- The big stations are in between. Genova Piazza Principe gives the arrival in 93 % of its stops, Brignole in 71 %, Savona and La Spezia Centrale in 64 %. I do not know whether the trains with no arrival time there are different from the others (later, earlier), so the delay at these stations is the delay of the trains that were measured.
- A few trains disappear on the way. 116 of the 14,983 trains (0.8 %) are marked
lost: the feed stopped answering before they arrived. They are left out of the journeys. - The collector sees each train about every 15 minutes, 13 times on a median train.
What runs
The week
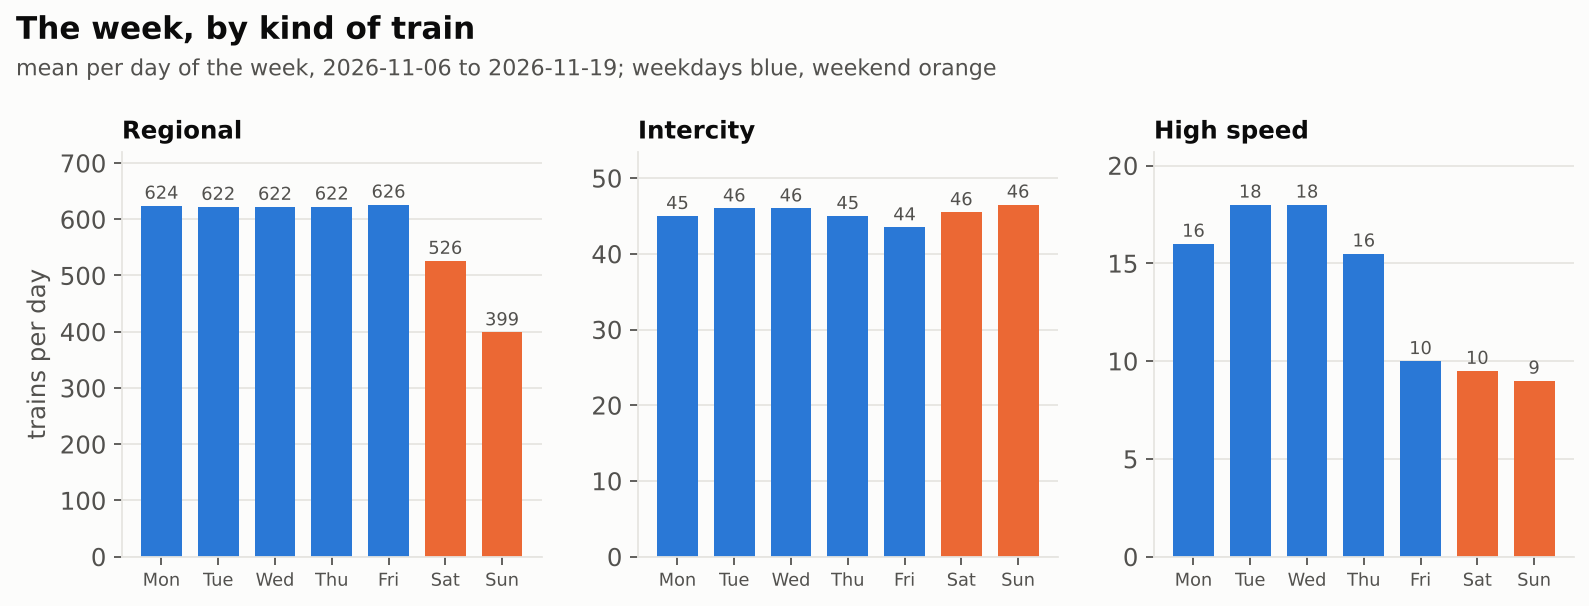
Fig. 6 gives the mean number of trains per day of the week. The weekend effect of a kind of train is its Saturday (or Sunday) count against the mean of the five weekdays.
$$ \Delta_{\text{Sat}} = \frac{\bar n_{\text{Sat}}}{\bar n_{\text{Mon-Fri}}} - 1 \quad \text{Eq (2)} $$
- $\bar n_{\text{Sat}}$ is the mean number of trains over the Saturdays of the window;
- $\bar n_{\text{Mon-Fri}}$ is the mean number of trains per day over the weekdays;
- $\Delta_{\text{Sat}}$ is the relative change: $-0.15$ means 15 % fewer trains on Saturday. The same formula with Sundays gives $\Delta_{\text{Sun}}$.
Over all trains it gives -15 % on Saturday and -33 % on Sunday. Regional trains, which are 91 % of the data, run at about 622 to 626 a day from Monday to Friday, drop to 526 on Saturday (-16 %) and 399 on Sunday (-36 %). The intercity trains (IC, ICN, EC…) ignore the weekend completely: about 45 a day, seven days a week. The high-speed trains are the opposite: 16 to 18 a day from Monday to Thursday, then about 10 from Friday on. With 10 to 18 trains a day, this last profile rests on small numbers.
The day
Counting how many trains are on the network at the same time draws the day.
$$ C(t) = \sum_{i} \mathbf{1}\left[\, s_i \le t \le e_i \,\right] \quad \text{Eq (3)} $$
- $i$ is one train, $s_i$ the time of its first stop in the network and $e_i$ the time of its last one (the real time when the feed gives it, else the scheduled one): the window during which the train runs on the 105 stations;
- $\mathbf{1}[\cdot]$ is the indicator: 1 if the condition inside is true, 0 otherwise;
- $C(t)$ is therefore the number of trains running on the network at time $t$. A long-distance train counts only for the part of its journey inside the area.
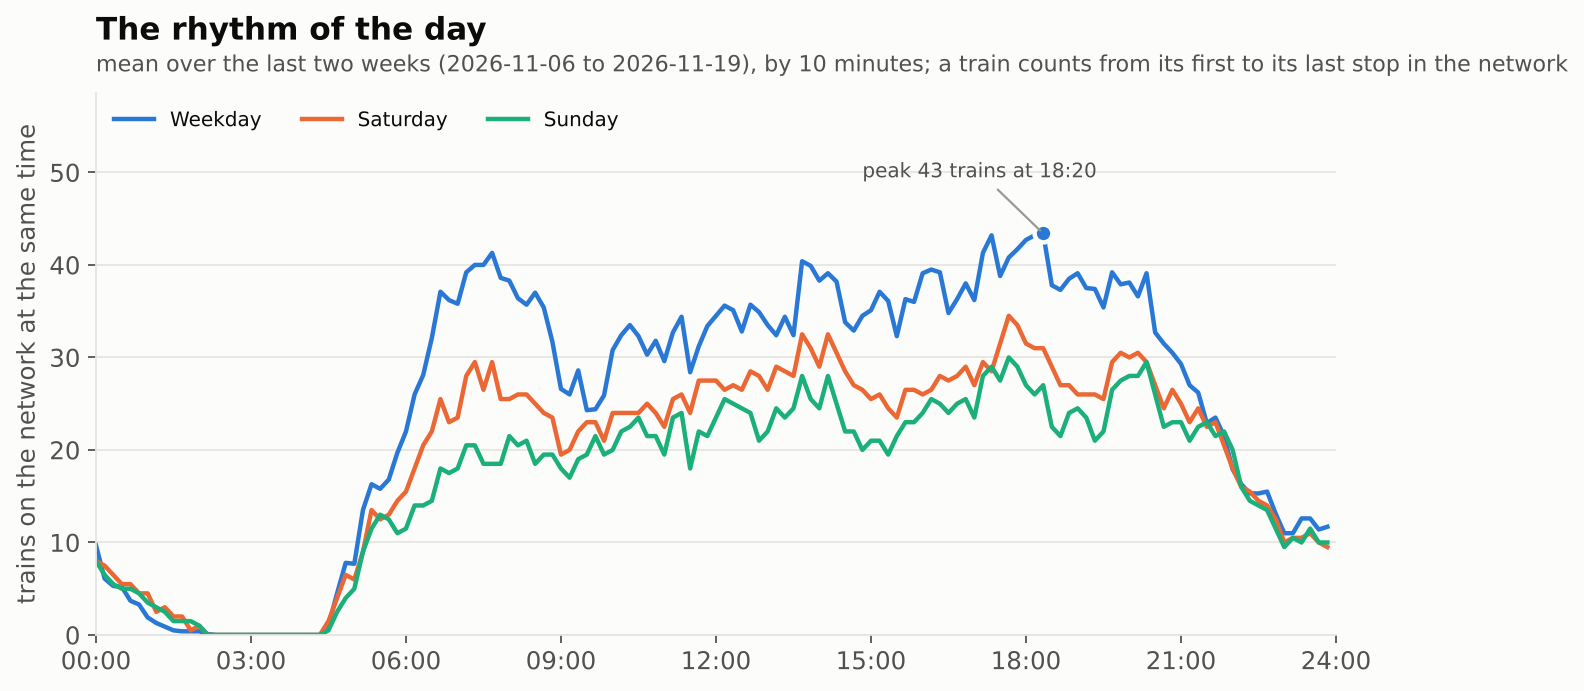
In Fig. 7, a weekday has two humps and a dip: about 41 trains at the same time around 07:40, a dip to about 24 around 09:30, then a long plateau of 35 to 40 trains that reaches the day’s maximum, 43 trains at 18:20. Morning and evening are close; the evening is slightly higher. The weekend is flatter and the evening clearly wins: on Sunday, about 22 trains at 08:00 against 30 at 17:40. Between 01:00 and 04:00 there is almost nothing, 0 to 4 trains at a time.
Where trains start and end
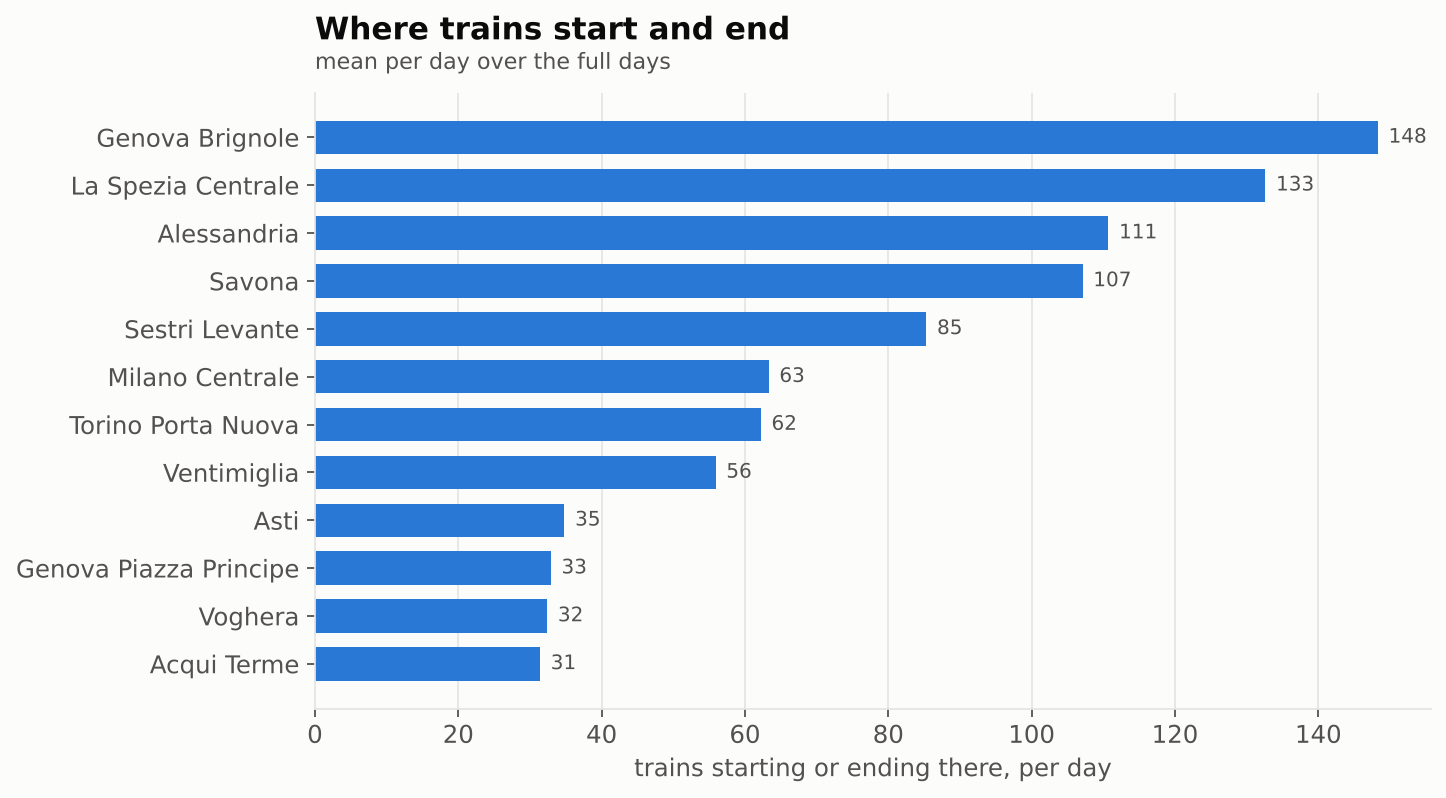
In Fig. 8, Genova Brignole comes first with about 148 trains a day starting or ending there, then La Spezia Centrale (133), Alessandria (111), Savona (107) and Sestri Levante (85). Genova Piazza Principe, the other big Genoa station, is only tenth with 33: this counts the first and last station of each train, so a station many trains pass through is under-counted by construction. The busiest routes, in both directions, are Savona and Sestri Levante (about 39 trains a day), Alessandria and Pavia (26) and La Spezia Centrale and Sestri Levante (26).
To measure how concentrated this is, rank the stations from the busiest and add them up one by one.
$$ S(k) = \frac{\sum_{j=1}^{k} c_{(j)}}{\sum_{j} c_{(j)}} \quad \text{Eq (4)} $$
- $c_{(j)}$ is the number of trains starting or ending in the $j$-th busiest station, so $c_{(1)} \ge c_{(2)} \ge \dots$;
- $k$ is how many stations are counted, starting from the busiest;
- $S(k)$ is the share of all the starts and ends carried by these $k$ stations. It goes from near 0 to 1.
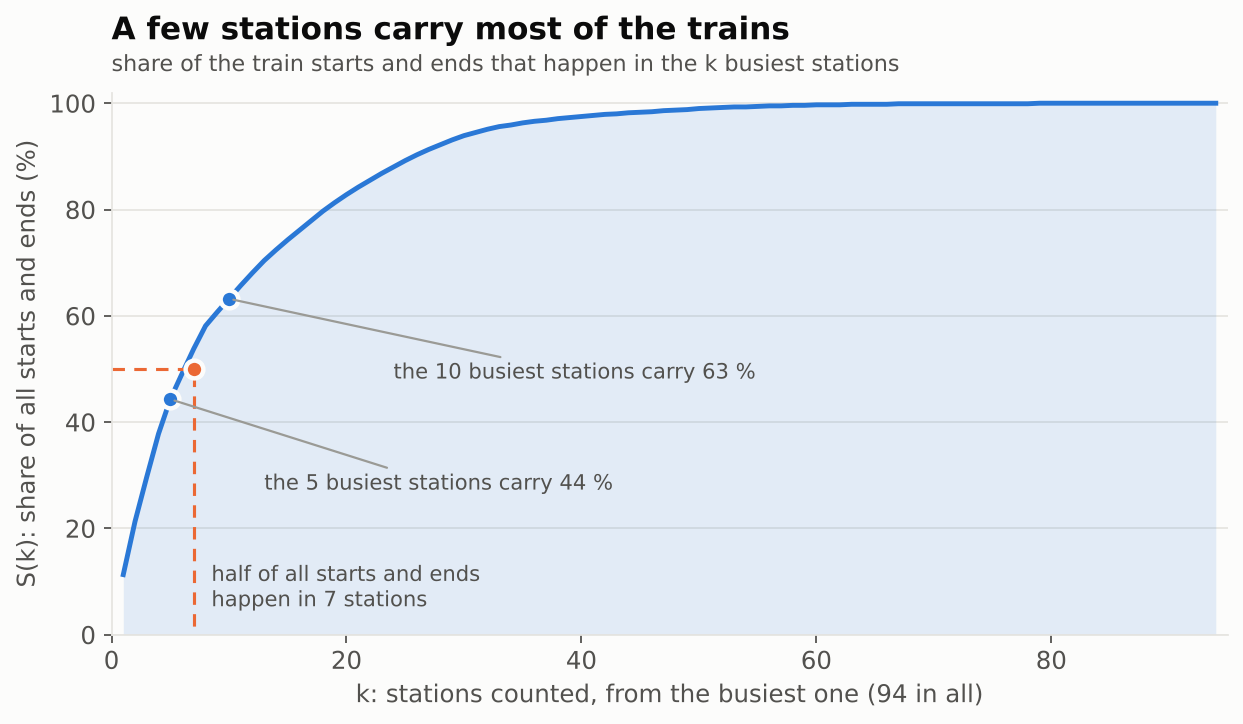
Fig. 9 shows a very concentrated distribution: $S(5)$ is 44 %, $S(10)$ is 63 %, and half of all starts and ends happen in 7 stations out of 94. Past the fortieth station the curve is flat: the other 54 stations carry less than 3 %.
How train numbers repeat
A train number is a service that comes back on the days it is scheduled. Counting on how many of the 30 days each number ran gives a distribution with sharp peaks instead of a bell.
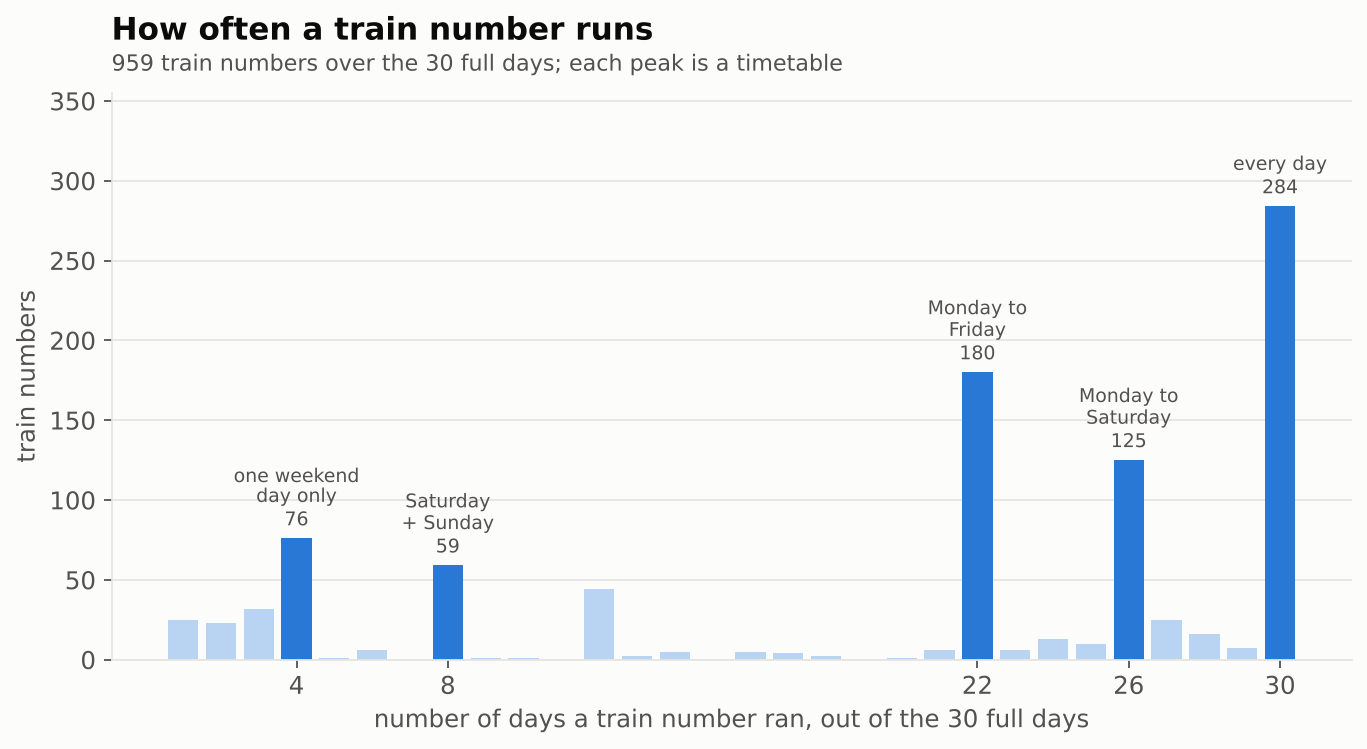
The peaks of Fig. 10 are the timetable showing through: 284 numbers ran all 30 days, 125 ran 26 days (Monday to Saturday), 180 ran 22 days (Monday to Friday), 59 ran 8 days (both weekend days) and 76 ran only 4 days (one weekend day). Over the last two weeks, 351 of 885 numbers ran every day of the week, 201 only from Monday to Friday, 120 from Monday to Saturday and 163 only at the weekend.
A timetable change the data caught
Weekdays hold at about 733 trains until the end of October, then at about 683 from 2 November, 7 % fewer. Nothing changed in the collector, so the change is in the trains. Comparing the train numbers of the first complete Monday-to-Friday week (26 to 30 October) with the last one (9 to 13 November) shows what moved.
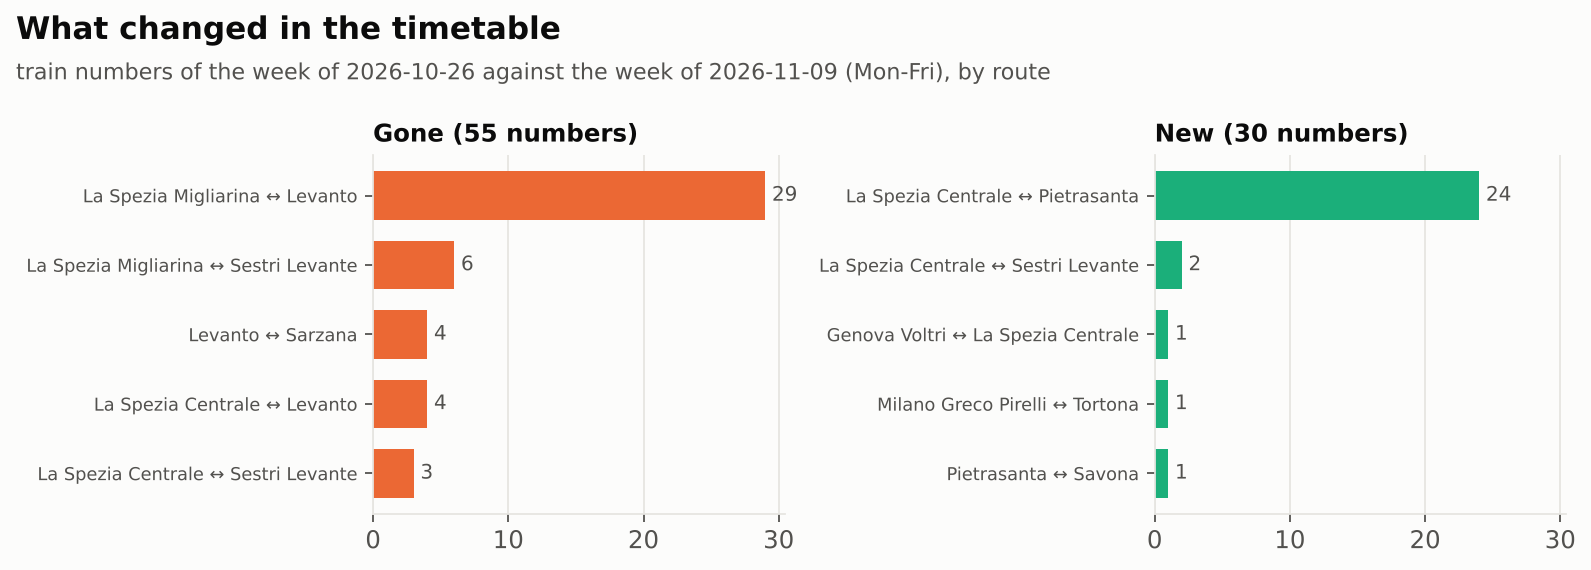
Fig. 11 shows the change: 55 numbers disappeared and 30 appeared. Of the 55, 29 are on the La Spezia Migliarina and Levanto line, and 44 ran for the last time on 1 November. Of the 30 new numbers, 24 are on La Spezia Centrale and Pietrasanta, all regional trains. It looks like a change of service on the Levanto and La Spezia section, with new trains going the other way out of La Spezia, towards Tuscany. The data shows what changed and when, not why.
How late it runs
The delay and its distribution
The delay of a stop is the one announced at the real arrival, in minutes. A stop is late when the delay exceeds 5 minutes, the threshold used throughout the project, and the late rate of a group of arrivals is the share of late ones.
$$ d = t_{\text{real}} - t_{\text{sched}}, \qquad \ell = \mathbf{1}\left[\, d > 5 \,\right], \qquad r = \frac{1}{N}\sum_{i=1}^{N} \ell_i \quad \text{Eq (5)} $$
- $t_{\text{real}}$ and $t_{\text{sched}}$ are the real and the scheduled arrival of a train at a station (
real_arrandsched_arr); their difference $d$ is the delay in minutes, which is whatdelay_arrstores. It is negative when the train is early; - $\ell$ is 1 when the arrival is late (more than 5 minutes), 0 otherwise;
- $N$ is the number of arrivals in the group studied, $\ell_i$ the value of $\ell$ for the arrival $i$, and $r$ the late rate of the group.
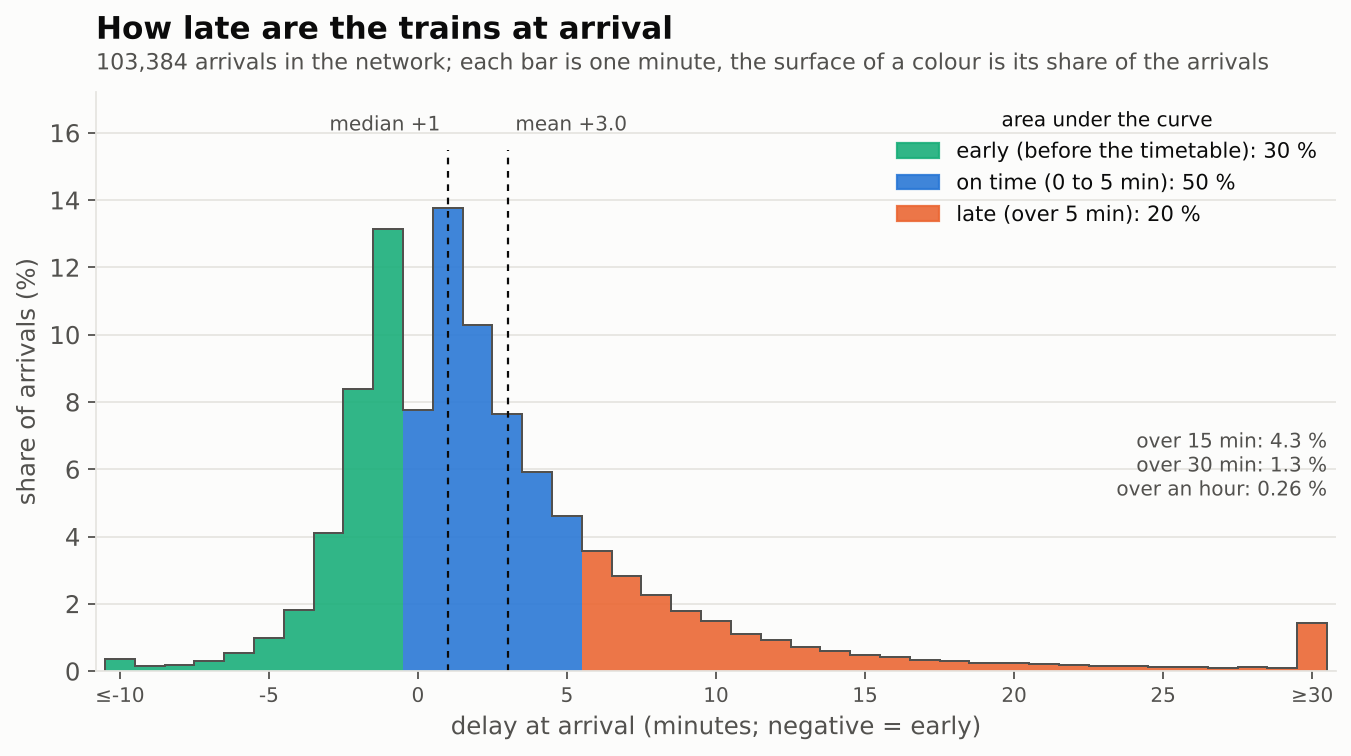
In Fig. 12, the distribution is asymmetric: the median delay is +1 minute, the mean +3.0 and the 90th percentile +9. The area under the curve is the whole story: 30 % of the arrivals are early, 50 % are within 5 minutes after the timetable, and the orange tail holds 20 %: the late rate $r$ of the network. 4.3 % are more than 15 minutes late, 1.3 % more than 30 minutes and 0.26 % more than an hour. Arriving early is a feature of the Italian timetable (a train can reach a station before its scheduled time, but should not leave before it). Most of the mass sits within 5 minutes of the timetable; the problems live in the tail.
Through the day and the week
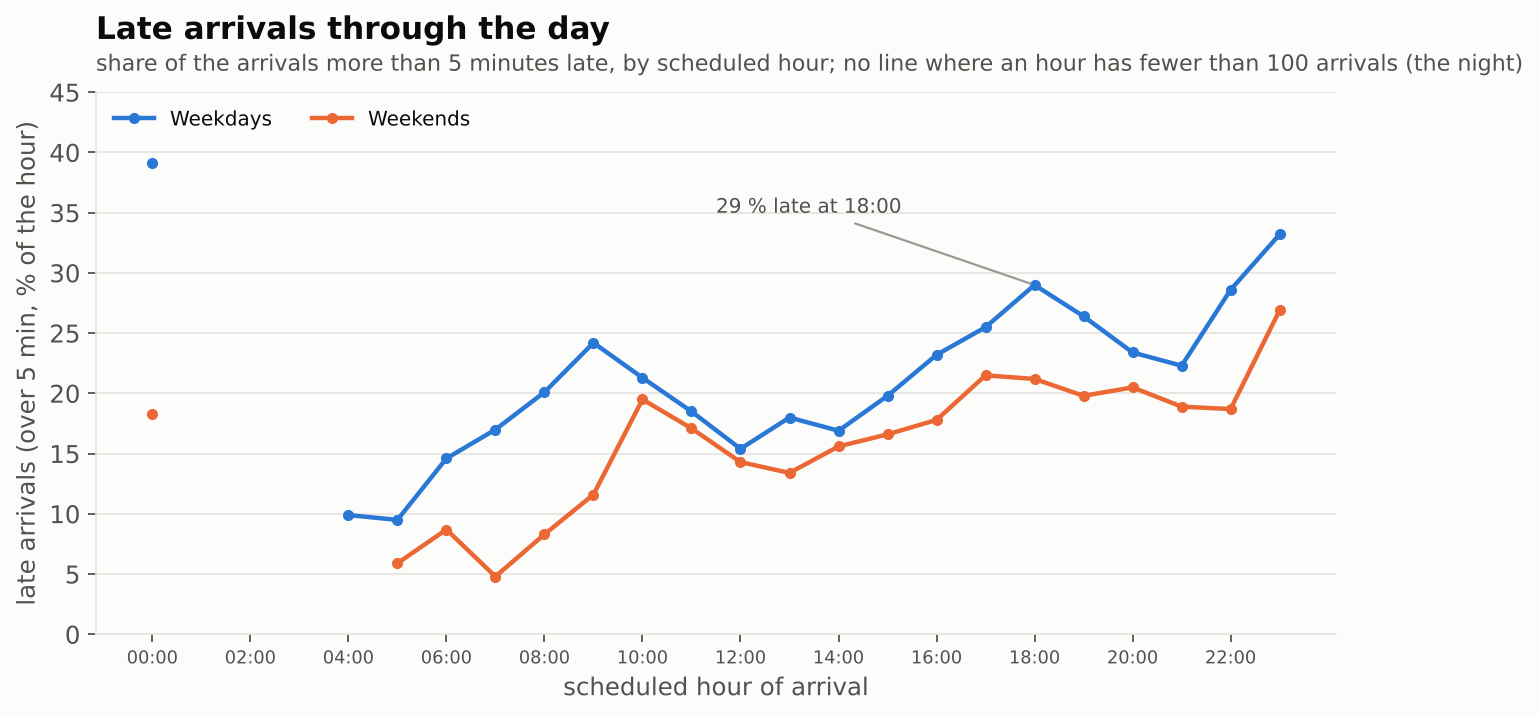
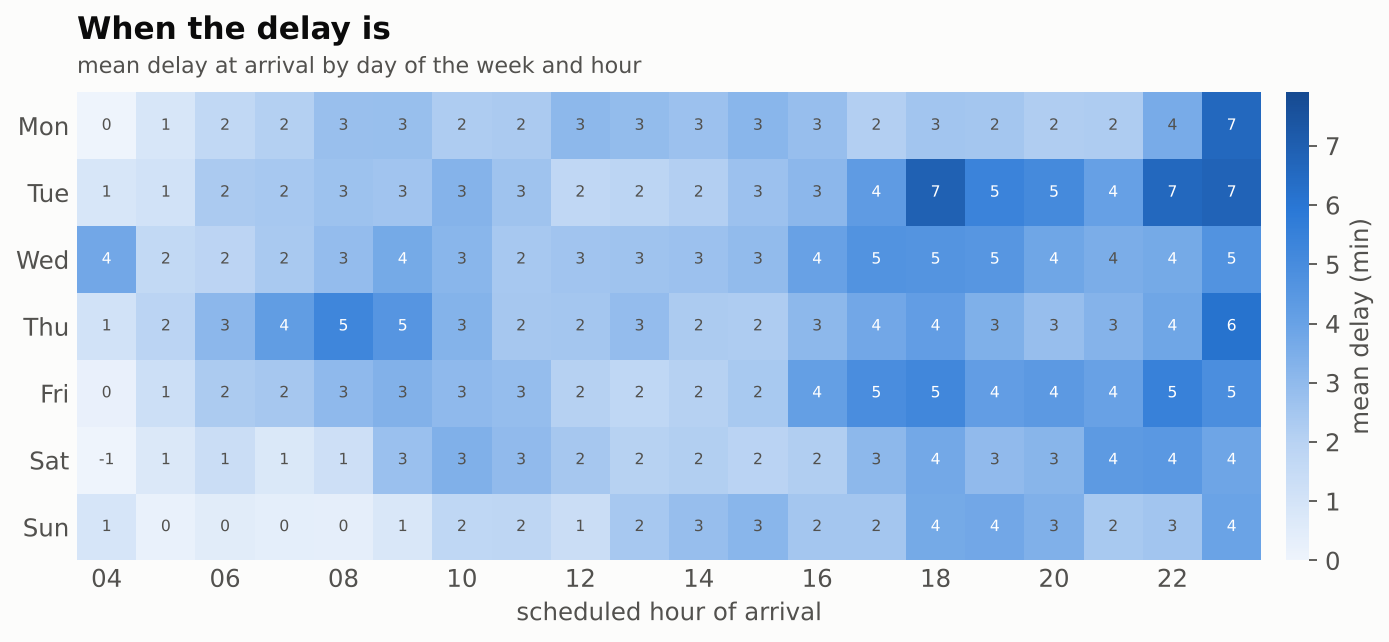
On weekdays (Fig. 13) the late rate is lowest early in the morning (9.5 % late at 05:00) and rises through the day, with a small bump at 09:00 and a maximum of 29 % late at 18:00, among the hours with real traffic. Past 22:00 it climbs again (33 % at 23:00), on few trains. The weekend has the same shape, lower: 4.8 % late at 07:00 on a weekend morning, 21 % at the evening peak. Fig. 14 adds the day of the week: the mean delay by day and scheduled hour.
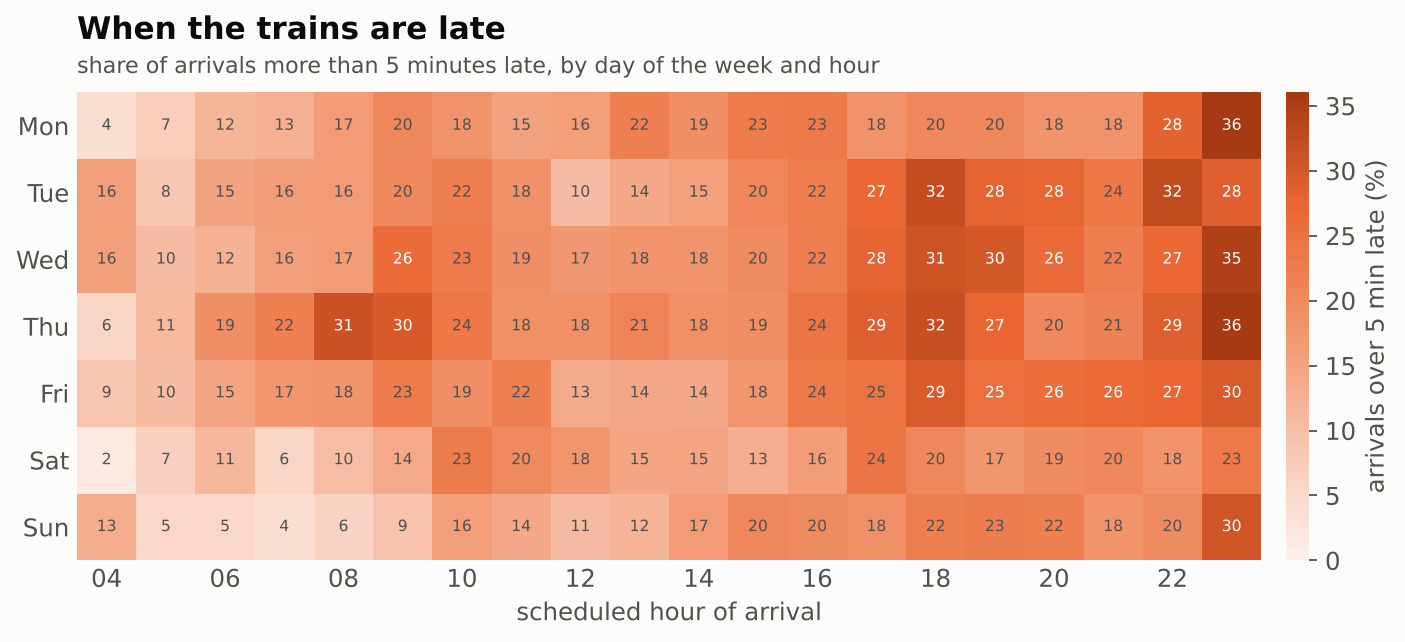
The same grid read as a late rate (Fig. 15) shows the same story: the weekday evening, 17:00 to 19:00, is the darkest band, with its peak on Tuesday at 18:00 (32 %), closely followed by Thursday at 18:00 (31.6 %), and the weekend mornings are the lightest. The late night is dark too (36 % on Monday and Thursday at 23:00), but those cells hold few arrivals.
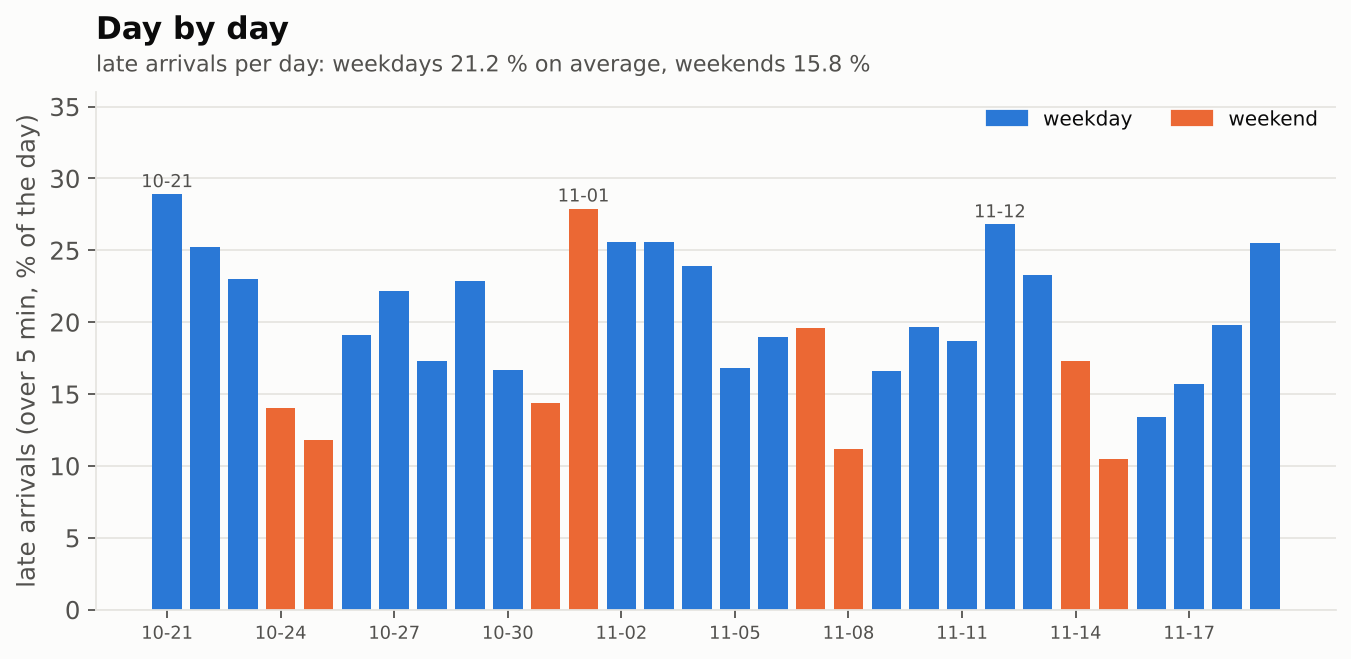
Day by day (Fig. 16), the worst are 21 October (28.9 % late), 1 November (27.9 %, a Sunday, All Saints’ Day) and 12 November (26.8 %). The best days are all Sundays: 15 November (10.5 %), 8 November (11.2 %) and 25 October (11.8 %). The data cannot say what happened on the bad days; it says they are the ones to look at.
By kind of train
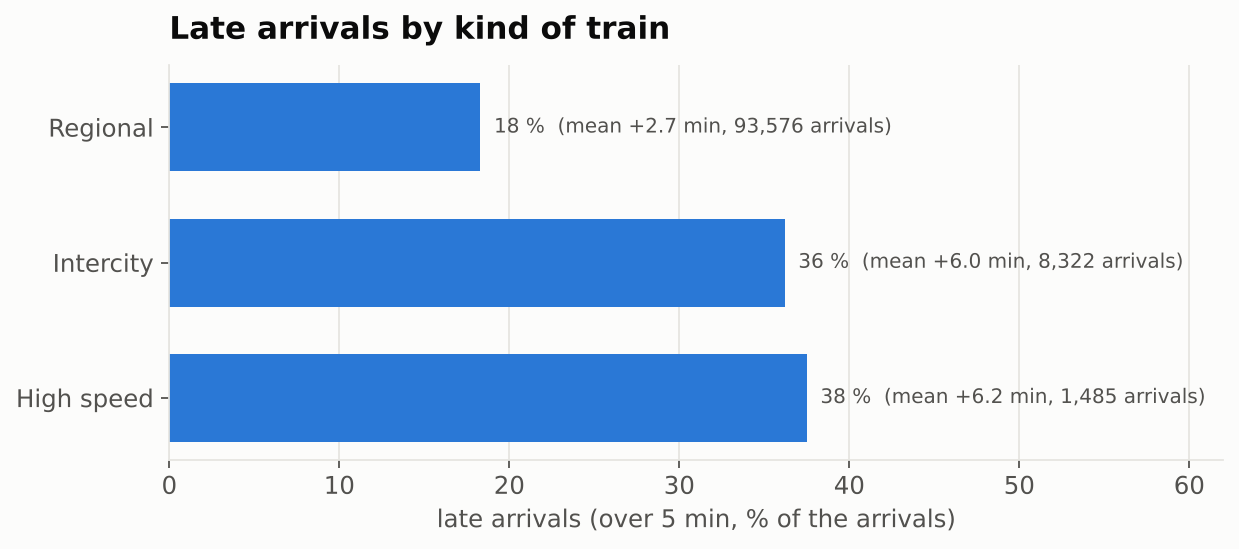
In Fig. 17, regional trains are late 18 % of the time (mean +2.7 minutes). Intercity and high-speed trains are late about twice as often: 36 % for the intercity (mean +6.0) and 38 % for the high-speed (mean +6.2, only 1,485 arrivals). A part of that is not the Ligurian network: these trains come from afar and arrive with a delay accumulated elsewhere.
Which stations
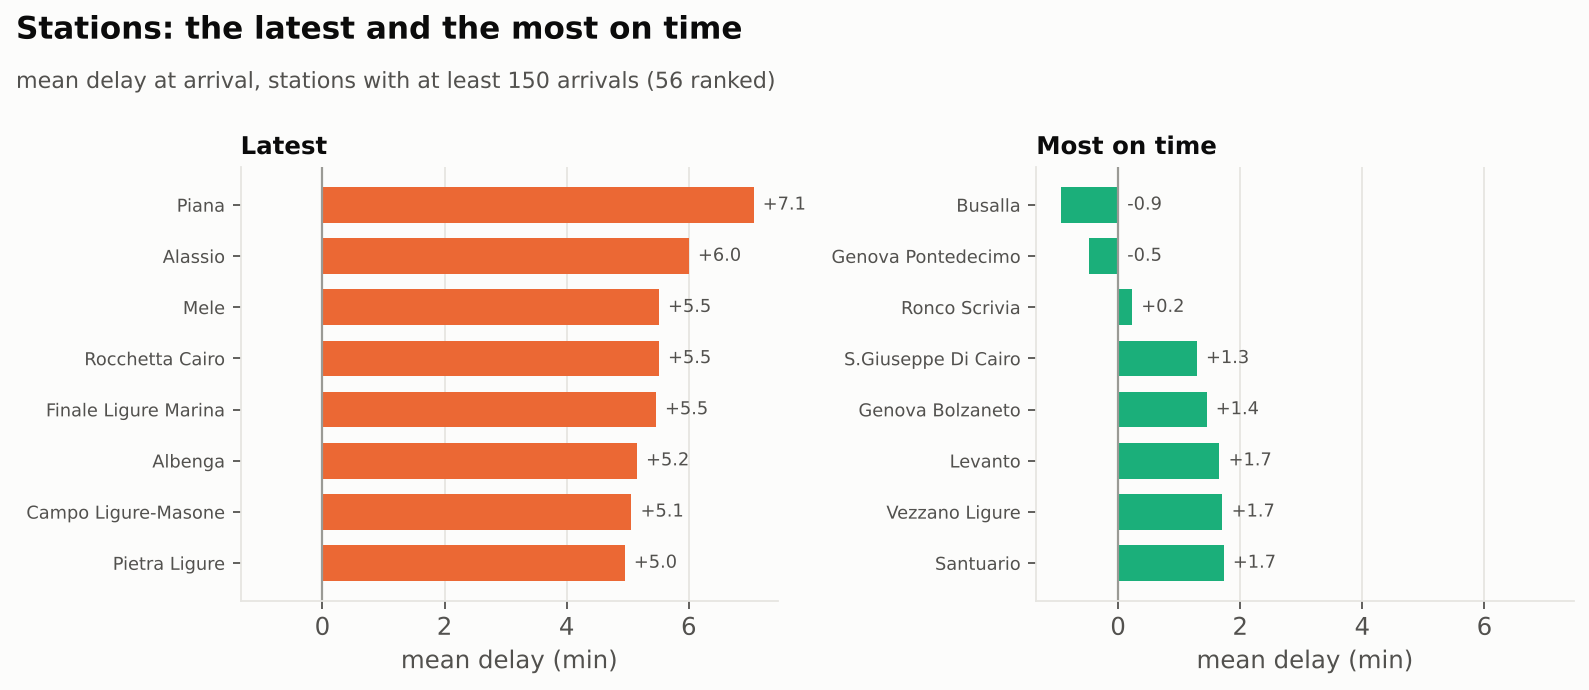
In Fig. 18, the latest stations are a mix of the coast west of Genoa, the Riviera di Ponente, and inland ones: Piana (+7.1 minutes, 47 % of the arrivals late), Alassio (+6.0, 43 %), Mele, Rocchetta Cairo, Finale Ligure Marina (+5.5) and Albenga (+5.2). Four of the eight latest are on that coast (Alassio, Finale Ligure Marina, Albenga, Pietra Ligure). The most on time are on the line from Genoa towards Milan and Turin: Busalla (-0.9 minutes, 6 % late), Genova Pontedecimo (-0.5) and Ronco Scrivia (+0.2). A station is not responsible for its own number: a delay is built before the train reaches it, so these figures describe where delays are more than where they start. One hypothesis does not hold: the Genoa stations are not worse than the others, with a mean of +3.0 minutes against +3.1 elsewhere.
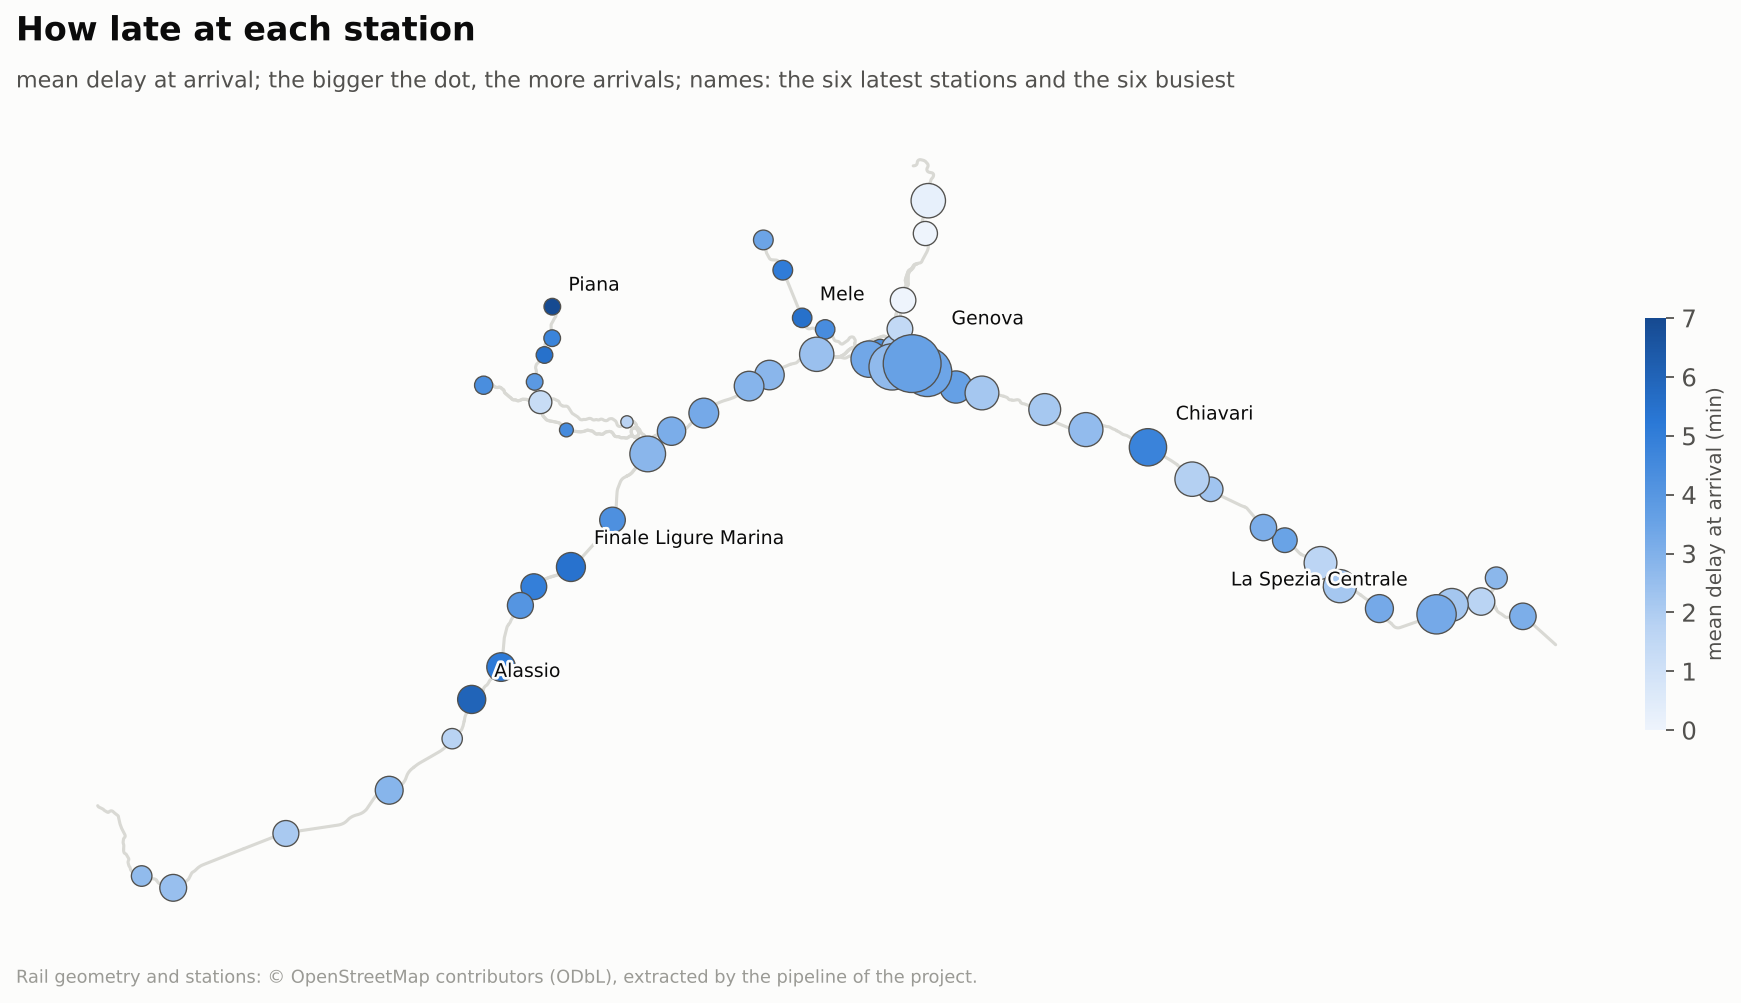
On the map (Fig. 19), the darkest dots (the latest stations) form a continuous stretch of the coast between Savona and Imperia, plus the branch towards Piana and Mele inland.
Where a delay builds and where it is recovered
Because the project has the topology of the network (the stations with their GPS positions and the sections between them), a delay can be located between two neighbouring stations. For a train leaving station $i$ and arriving at its neighbour $j$, the delay added on the section is:
$$ a_{ij} = d^{\text{arr}}_{j} - d^{\text{dep}}_{i} \quad \text{Eq (6)} $$
- $d^{\text{dep}}_{i}$ is the delay of the train when it leaves $i$ (
delay_dep); - $d^{\text{arr}}_{j}$ is its delay when it reaches the next stop $j$ (
delay_arr); - $a_{ij}$ is what the train added on the section. A negative $a_{ij}$ means it gave time back.
Only pairs of consecutive stops of a train that are a section of the network count, and an $a_{ij}$ is clipped between -20 and +40 minutes, since a few runs of 100 minutes are a train waiting rather than a section. Over 66,878 runs between neighbouring stations, the mean is -1.7 minutes and the median -2: only 7.6 % of the runs add delay. Trains recover time almost everywhere, which is what a timetable with slack in its running times produces (an interpretation, the data only shows the effect).
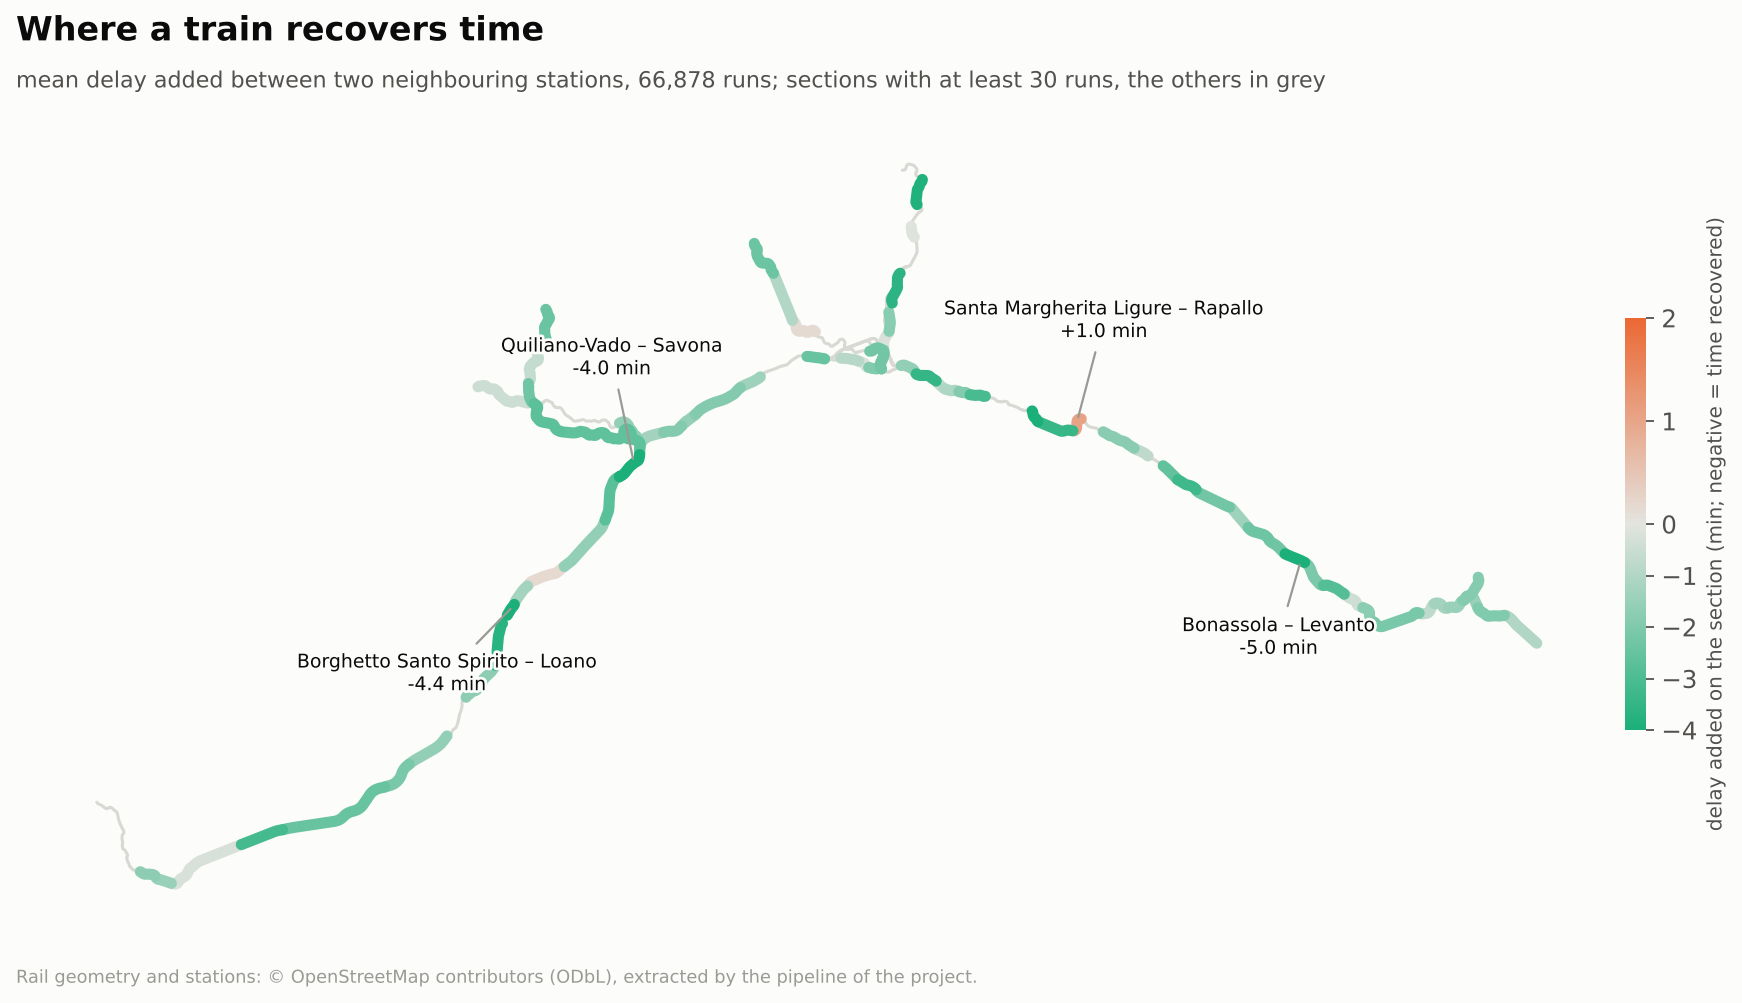
In Fig. 20, the sections that give back most are Bonassola to Levanto (-5.0 minutes, 656 runs), Borghetto Santo Spirito to Loano (-4.4), Quiliano-Vado to Savona (-4.1) and Recco to Camogli (-4.1). The only section that adds a noticeable delay is Santa Margherita Ligure to Rapallo, +1.0 minute on 1,301 runs.
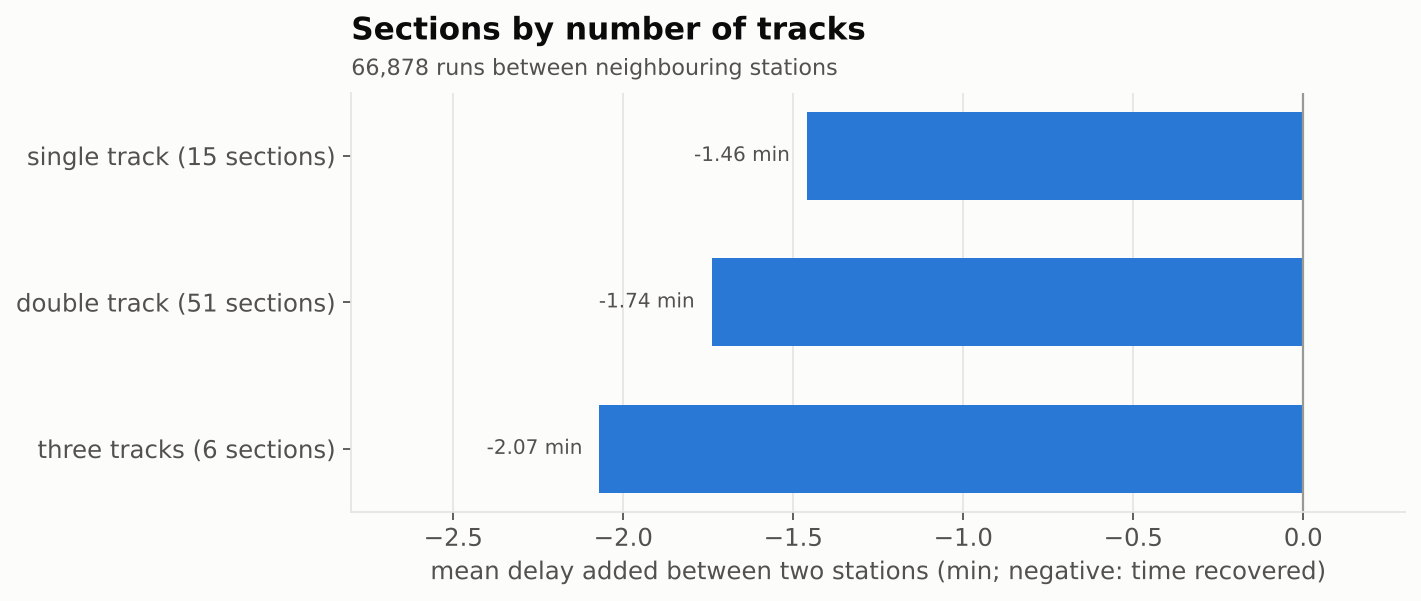
Does the number of tracks matter (Fig. 21)? A little, and in the expected direction: single-track sections give back 1.5 minutes on average, double-track ones 1.7 and three-track ones 2.1. The gap is a few tenths of a minute, far less than the differences between stations.
Along a journey
A section is one step; a journey is the sum of them. A train carries its delay from station to station, and two questions follow. When a train leaves late, how much of the delay does it recover on the way? And does a late start still mean a late end? Take the trains whose origin is in the network, so that their departure delay is measured, and follow the delay from the departure to the last stop in the network.
$$ g = d_{\text{dep}} - d_{\text{end}} \quad \text{Eq (7)} $$
- $d_{\text{dep}}$ is the delay at the departure from the origin (
delay_depof the first stop); - $d_{\text{end}}$ is the delay at the last stop of the train inside the network (
delay_arrof the last stop); - $g$ is the time recovered on the journey, in minutes: positive when the train arrives less late than it left, negative when it loses time.
The delay along the journey and the time recovered are in Fig. 22.
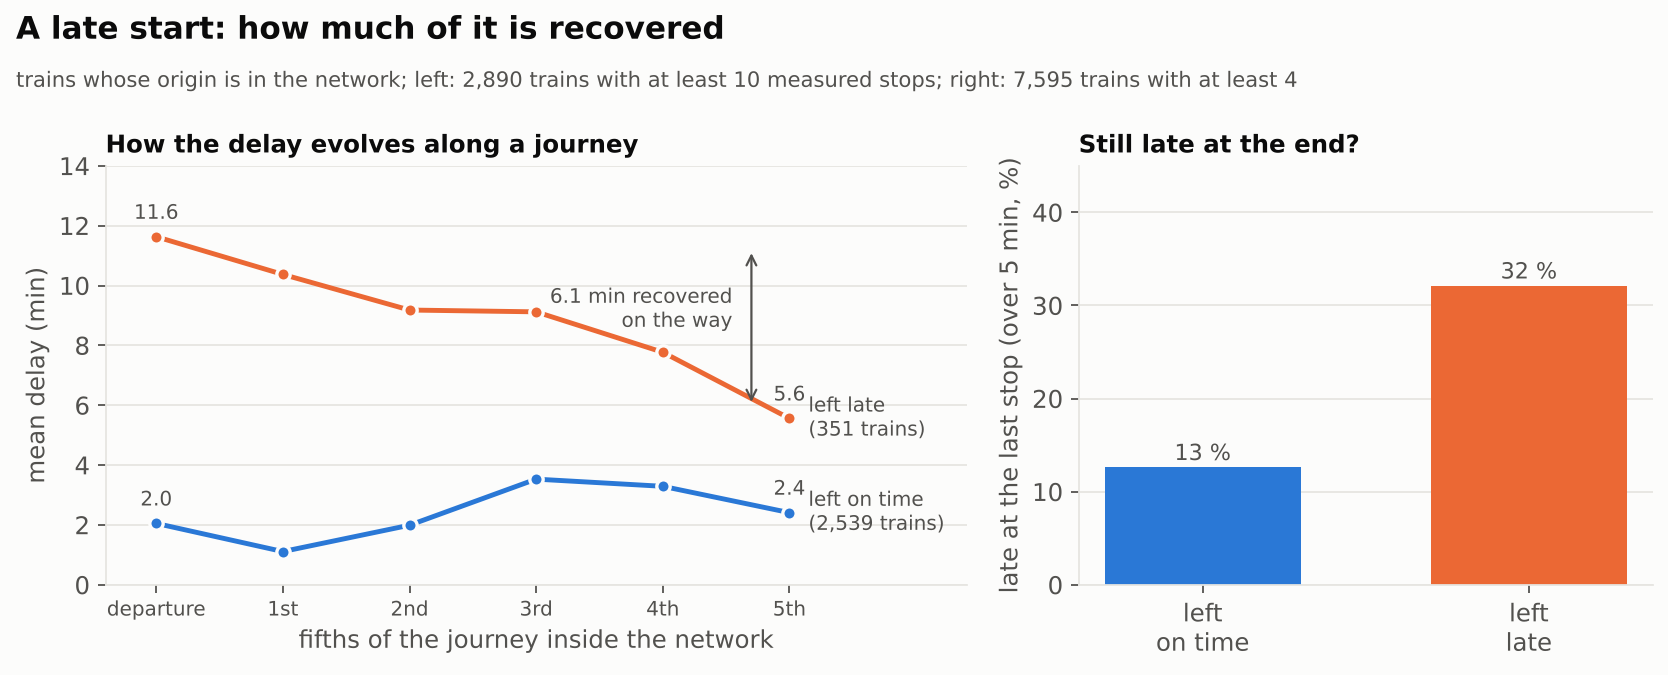
The second question is a conditional probability. Among the 7,595 trains whose origin is in the network (with at least 4 measured stops), 12.3 % leave late. For $x = 1$ (left late) or $x = 0$ (left on time):
$$ P(\ell_{\text{end}} = 1 \mid \ell_{\text{dep}} = x) = \frac{\text{trains with } \ell_{\text{dep}} = x \text{ and } \ell_{\text{end}} = 1}{\text{trains with } \ell_{\text{dep}} = x} \quad \text{Eq (8)} $$
- $\ell_{\text{dep}}$ is 1 when the train left its origin late ($d_{\text{dep}} > 5$), 0 otherwise;
- $\ell_{\text{end}}$ is 1 when it is late at its last stop in the network ($d_{\text{end}} > 5$);
- the left side reads the probability of being late at the end, knowing how the train left, estimated here by a simple count over the trains.
A train that leaves late is late at the end 32 % of the time, against 13 % for a train that left on time: 2.5 times more likely. But two thirds of the trains that leave late do get back within 5 minutes: the slack of the sections works on the whole journey.
Repeat offenders
Some train numbers are late much more often than others. Keeping the 361 numbers followed on at least 20 runs, here are the extremes, measured at the last stop in the network.
| Train | Route | Runs | Mean delay at the end | Late (over 5 min) |
|---|---|---|---|---|
| ICN 794 | Reggio di Calabria to Torino Porta Nuova | 22 | +23.9 min | 36 % |
| FA 8596 | Roma Termini to Genova Piazza Principe | 23 | +16.2 min | 78 % |
| REG 3277 | Genova Brignole to La Spezia Centrale | 30 | +12.9 min | 50 % |
| FB 8630 | Roma Termini to Genova Piazza Principe | 26 | +12.5 min | 54 % |
| REG 12410 | Sestri Levante to Savona | 21 | +12.4 min | 29 % |
| REG 12218 | La Spezia Centrale to Sestri Levante | 30 | -6.6 min | 0 % |
| REG 12397 | Savona to Sestri Levante | 26 | -5.8 min | 4 % |
The distribution is wide: 82 of the 361 numbers (23 %) are late less than 5 % of the time, and 12 (3 %) more than half of the time. The two ends are not the same kind of train: the late ones are mostly long-distance trains that bring a delay from far away, and the on-time ones are mostly short regional trains, some of which arrive on average more than 5 minutes early.
Limits
This study describes a month of autumn in one area. Four limits matter when reading the figures:
- A month is short. It is enough for the weekly and daily shapes, not for seasons, strikes or works. The Levanto change may be a winter timetable or a temporary one.
- Some stations stay silent. A third of the stops have no real arrival time, and the stations that never give it are absent from the delay figures by station (see How much the stations tell).
- A station is not the cause of its delay. The figures by station and by section say where delays are and where they change, not why.
- Part of the delay is not Ligurian. Long-distance trains arrive late from elsewhere. The stops outside the network are left out, but the delay a train carries into the network stays.
- The source is not officially documented. I read ViaggiaTreno through an interface that has no official documentation, only community notes [2], [3], and the figures are what the service publishes, not an audited record.
Quick remember
- The network is busiest at 18:20 on a weekday, with 43 trains at once. Half of all the train starts and ends happen in 7 stations out of 94.
- Sunday has 36 % fewer regional trains (399 against about 623 on a weekday). Intercity trains stay at about 45 a day.
- Delays are small and lopsided: the median is +1 minute, 30 % of the arrivals are early, and only 20 % are more than 5 minutes late.
- The worst busy hour is Tuesday at 18:00, with 32 % of the arrivals over 5 minutes late.
- A train that leaves late is about 2.5 times more at risk of arriving late (32 % against 13 %), but it recovers about 6 minutes on the way.
- This is one month in one area, recorded from ViaggiaTreno: it shows where and when, not why.
References
All the figures come from my own collector and my own analysis: there is no external dataset behind them. The references below cover the origin of the data and of the map.
- ViaggiaTreno, the Trenitalia train information service. viaggiatreno.it
- ViaggiaTreno API wiki: community notes on the interface, which has no official documentation. github.com
- Home Assistant, the ViaggiaTreno integration. home-assistant.io
- OpenStreetMap, copyright and licence: rail geometry and stations on the maps, © OpenStreetMap contributors. openstreetmap.org
- Open Data Commons, Open Database Licence (ODbL) 1.0: the licence of the OpenStreetMap data. opendatacommons.org